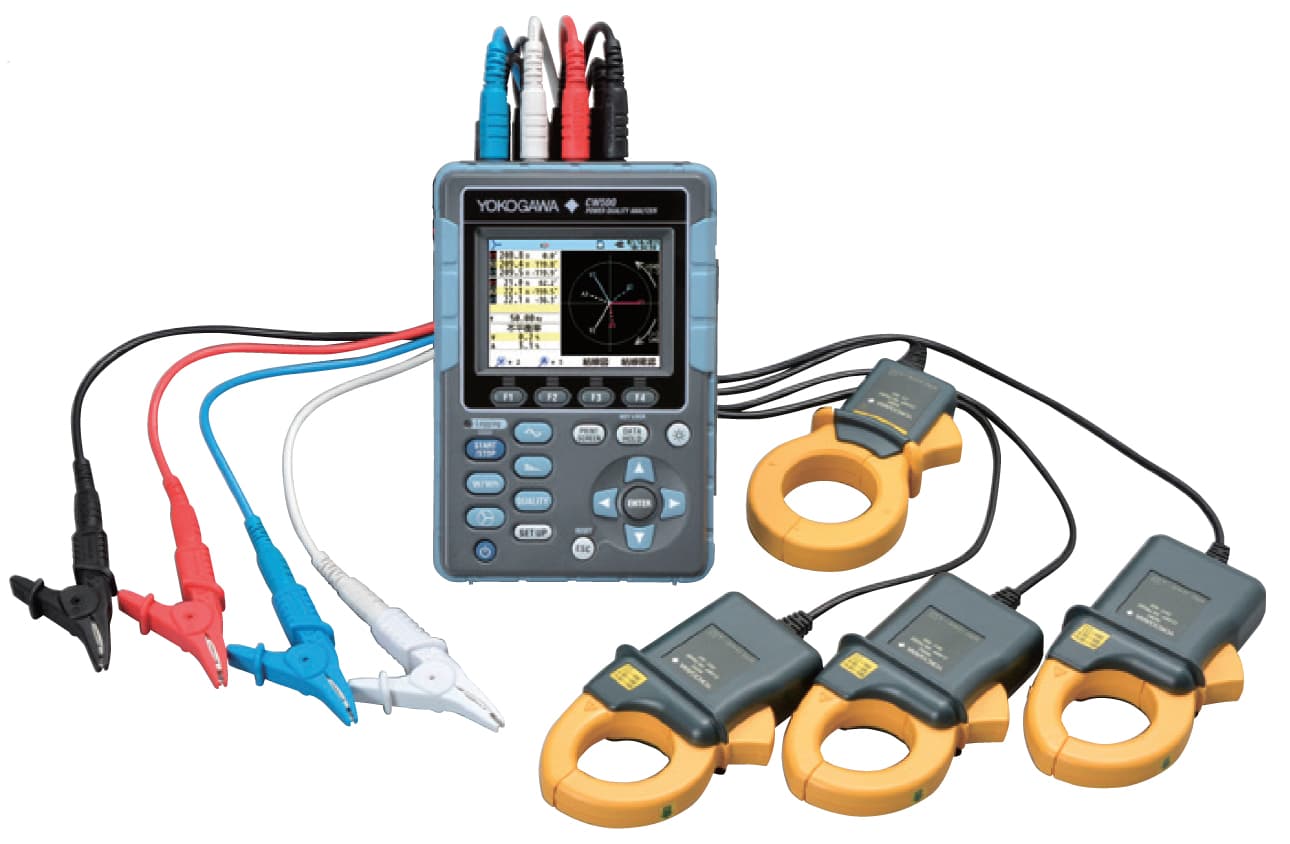
Yokogawa Portable Power Quality Analyzer, CW500

- Product Type: Energy Analyzers
- receiptGST Invoice
- headphonesCustomer Service
- lockSecure Payments
- policyReturns & Warranty
- home_pinOrder Tracking
- paymentsBuy in Installments
₹435420 (Incl. of all taxes)
₹369000+ ₹66420 GST (18%)
7 Business Days
1 Pcs
9030
picture_as_pdfBrand Authorization Certificatekeyboard_double_arrow_right
picture_as_pdfDownload Bosch Cataloguekeyboard_double_arrow_right
Highlights
The Yokogawa CW500 is a portable power meter that utilizes current clamp-on probes, easy to use navigation screens and bluetooth and SD cards for communication and data logging. These features enable user-friendly power consumption and power quality measurements in the field that conform to IEC61000-4-30 Class S. This standard dictates that two measuring instruments of similar rating must measure within some percentage of each other when exposed to the same signal.
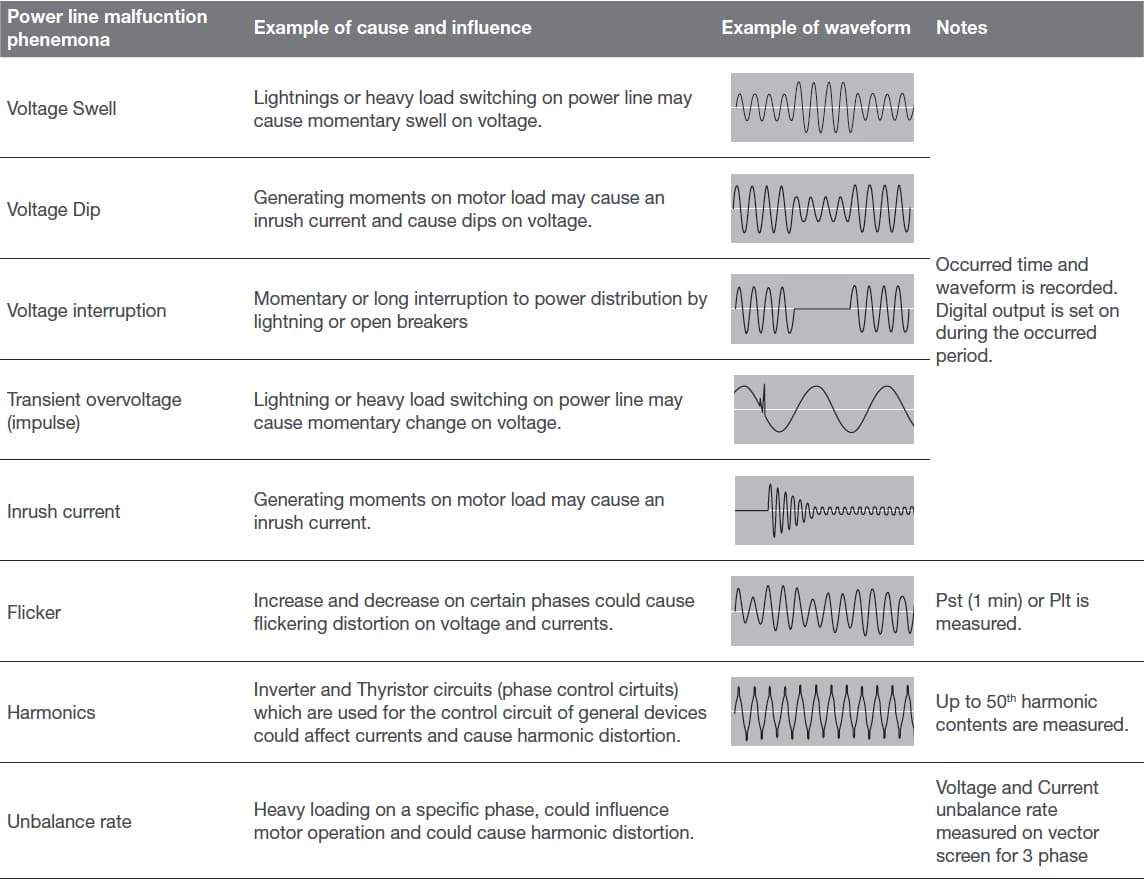
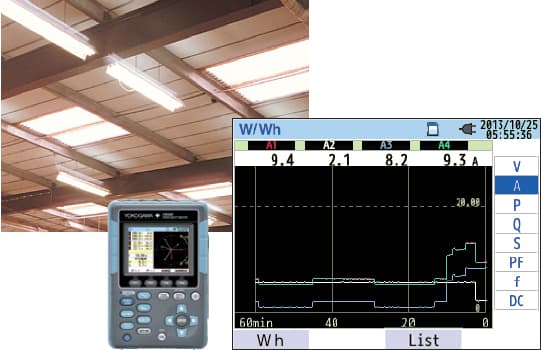
Utilities and substations contain large arrays of transformers, generators and electrical distribution networks. To maintain the health and safety of such infrastucture, a reliable power quality analyzer is needed. This power quality analyzer should be capable of not only logging single to multi-phase power, but also trend and monitor anomalies in the power system such as voltage sags,swells and dips, as well as flicker, inrush current, and demand changes.
Features:
- Power Measurement and Logging
- Power Quality Measurement
- User Support
- Analysis of Data and Report Generation
Varied Functionality
- Log anything from single phase two wire to three phase four wire systems, and everything in between
- Capture irregularities in your power system such as voltage sags,dips, swells and log them conviently to RAM or an SD card
- Log upto 50th orders of harmonics
- Vector display for convenient tracking of voltage/current phase relationships
Portability
- Small form factor and battery inputs allow the user to take this unit anywhere, anytime
- Use the free CW500 viewer to connect remotely to the unit to log data or view events in real-time
Ease of use
- Quickly and easily shift between setting up the unit or viewing logged variables and waveforms
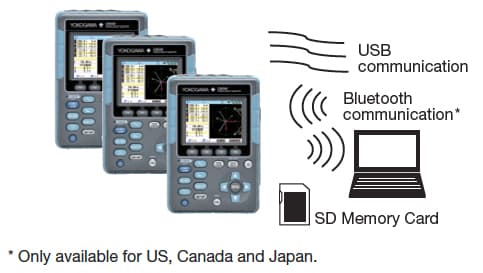
- Supports USB and bluetooth
- Set a predetermined record length or schedule or a start time and duration for logging data
Power Measuring and Logging
 |
|
User Support:
|
Quick Start Guide Function:
|
|
Vector Display:
|
Power Quality Measuring:
|
Measure Temporary Malfunctions of the Power Line
|
|
Measure Continuous Malfunction of the Power Line
|
|
CW500 Viewer (Included PC software)
|
|
Types of data
|
|
Memory card and interface
|
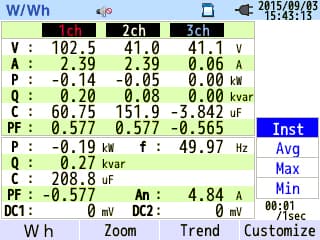
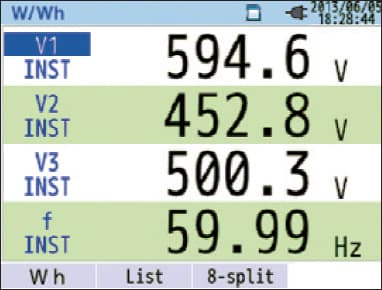
Power Measuring:
|
Power line and Input Channel: 3 CH Voltage, 4 CH for Current Clamp Probe. 1P2W (up to 4 systems), 1P3W (up to 2 systems), 3P3W2current (up to 2 systems), 3P3W3current, 3P4W |
|
Power measuring item: (Instantaneous, average, maximum, and minimum values for each setting period) Voltage/Current/Power (Active, Reactive, Apparent)/Power Factor/ Phase Angle/Frequency/Calculated Phase Shift Capacitance/DC voltage value 2 CH. |
|
Integration Value Energy (active, reactive, apparent), Demand (list or graph display of change in a specific period and as a whole) |
|
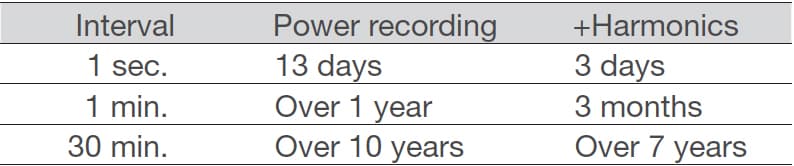
Recording Interval Period 1/2/5/10/15/20/30 second, 1/2/5/10/15/20/30 minute, 1 hour/2 hours |
|
Recording method Manual, time, period |
 |
|
Estimated Recording Length with 2 GB SD card
|
|
Various Measuring Screen
|
 |
|
List Display
|
 |
|
Zoom Display
|
 |
|
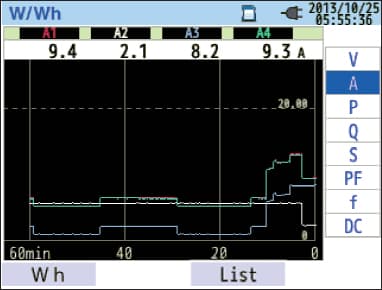
Trend Graph
|
 |
|
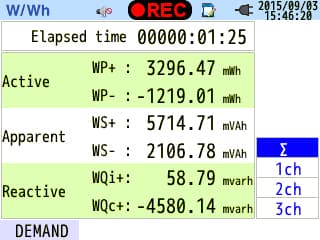
Energy Display List of active, apparent, reactive by consumption or generation. |
|
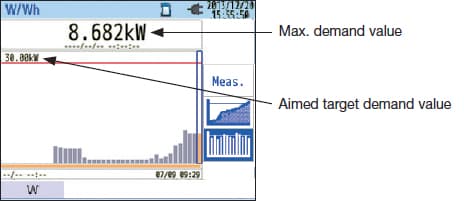
Demand measuring Demand is the average power value of a specific period (usually 30 minutes). The contract with the power supplier conditionally concerns the maximum average power value between a period for the consumption fee. This function supports how to maintain within the target consumption by monitoring the estimated demand value to the setting rate with the maximum demand value. |
| List of Demand Value |
Graph display of change on specific period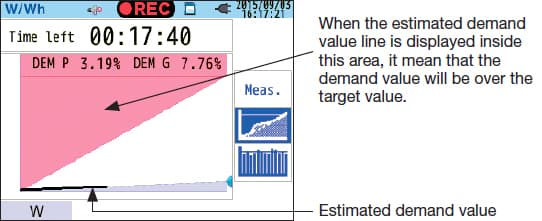 |
|
Graph display of whole demand trend |
Analysis and Reporting of recorded data:
Analysis and reporting is enabled by simply clicking on the desired data on the software screen. Analysis can be viewed by trend graph, overage, maximum and minimum value of voltage current, power, and power factor. Report generating can be set daily by daytime, nighttime, working day, or off day. It can also be set on a monthly period based on daytime or nighttime, working day or off day. Additionally, energy data to quantify into crude oil barrels or CO2 can also be converted.Trend analysis graph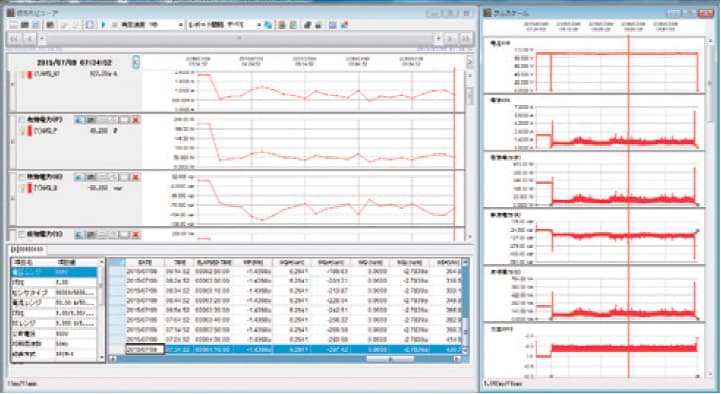 |
Sample of report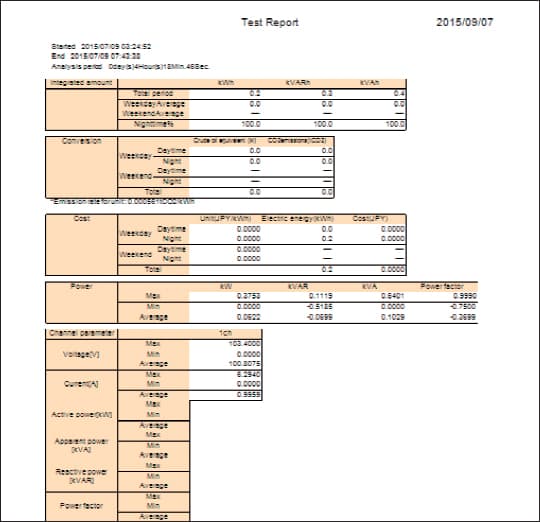 |
 |
Power Quality Function
|
User Support Function
| User Friendly |
Quick start guide and automatic type of clamp recognition
|
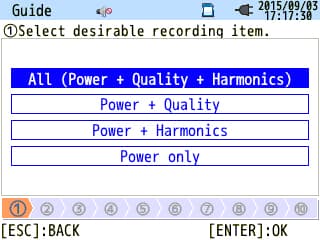 |
|
Start of guidance
|
|
|
Wiring
|
 |
|
Wiring check/self diag./self id.
|
 |
|
Recording setting
|
 |
|
Power supply from measuring line
|
 |
|
Leakage current measuring
|
|
4 system load measuring
|
Software for Analysis and Setting (Free) CW500Viewer
Data analysis, data reporting, making a setting file and doing a real time measurement can be easily done with the CW500Viewer. The data can be transferred by SD memory card, USB communication or Bluetooth communication (for USA, Canada, Japan only).
 |
|
The graph and lists are created by a click on the data file.
|
|
Settings management
|
|
Real time measurement
|
System Requirements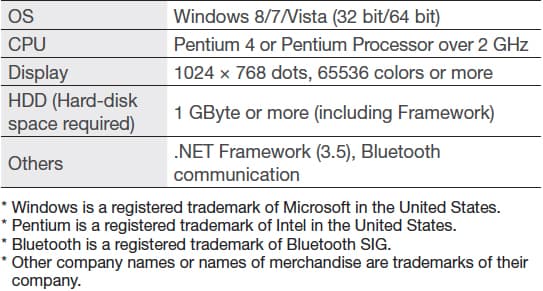 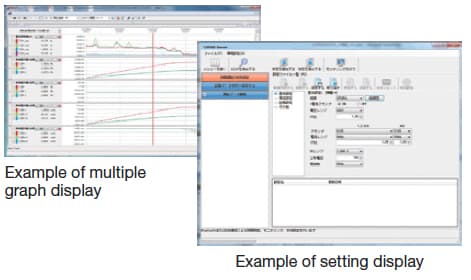 |
Applications:
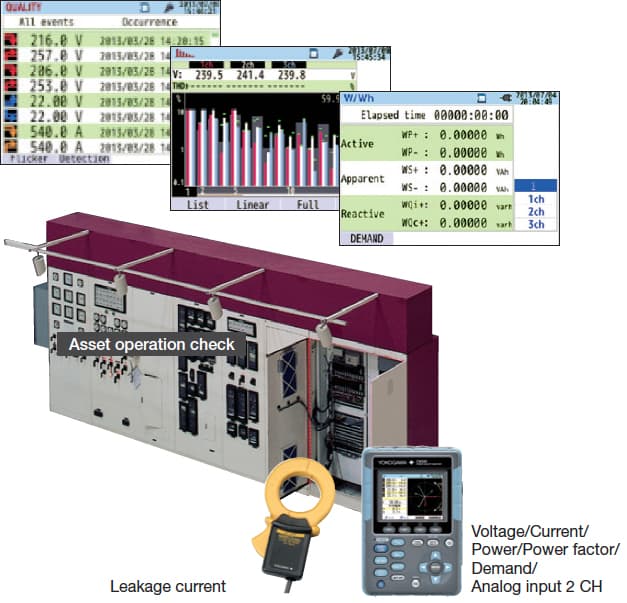 |
| Power Measuring + Power Quality Examination
Examination of main power line quality for factory system control and assets
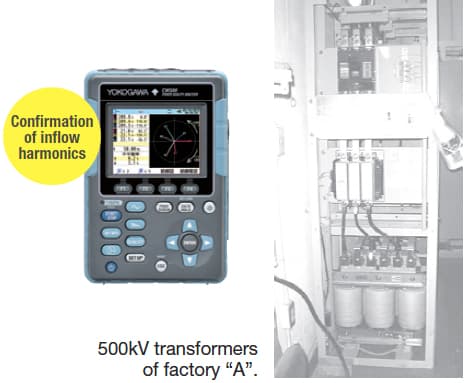
The CW500 not only continuously measures harmonics but it also captures malfunctions of the power line and records the occurrence time with waveforms. Simultaneously, it can measure the power and leakage current of a neutral phase. Additionally, users can confirm the condition of assets when signals are connected to the DCV input channels. |
 |
Power Line Measuring Examination
|
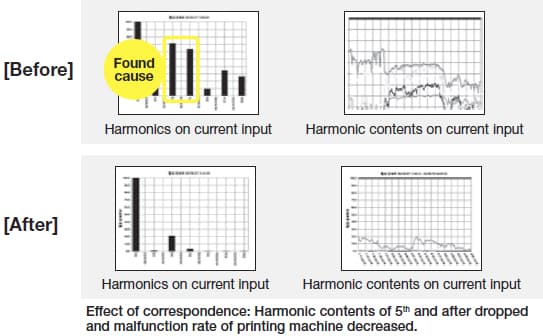
Improving power line quality of a printing factory by measuring harmonics (Printing factory)
|
  |
|
Improving the power factor for power efficiency
|
Connection Interfaces:
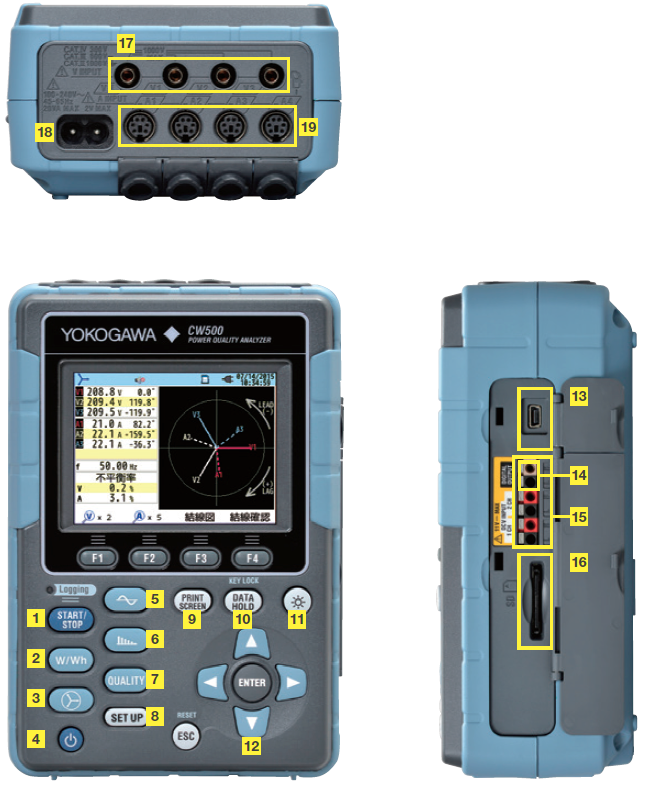 |
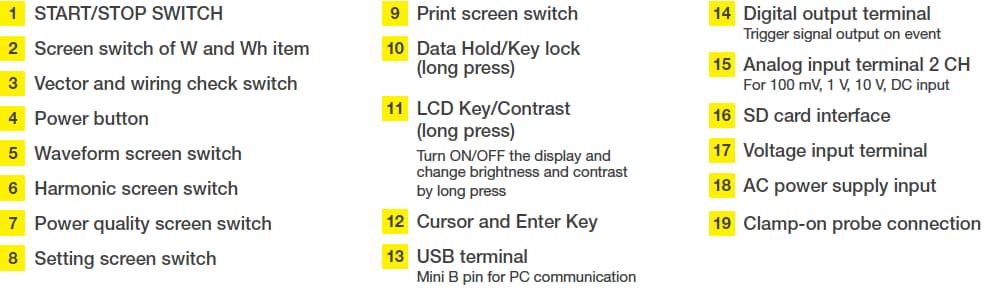 |
Accessories:
- 7x Clamp-on probes (96060, 96061, 96062, 96063, 96064, 96065, 96066)
- Extension cable (98082)
- Power supply adapter (98031)
- Portable case (93047)
- Conversion Cable (Banana-DIN) (99073)
- Voltage Probe (98078)
- Carrying Case (93046)
- SD Memory Card (2 GB) (97060)
Please Note that Product may differ eg. colour, size from the product Image displayed on website. Kindly check the specifications provided to make better purchase decision. M.R.P Prices and specifications are subject to change without notice.
Specifications
| SKU | ME.EL.EN.00028 |
|---|---|
| Product Type | Energy Analyzers |
| Model No | CW500 |
| Origin | Made in Japan |
You May Also Like
Shop By Related Categories
Yokogawa Portable Power Quality Analyzer, CW500
Visit Yokogawa Store keyboard_double_arrow_right₹435420 (Incl. of all taxes)
₹369000+ ₹66420 GST (18%)